Operators of industrial equipment constantly interpret and diagnose anomalies, patterns, and alarms that come from their equipment. The operators assign these tasks to engineers, who manually analyze them using the knowledge that they have developed over time.
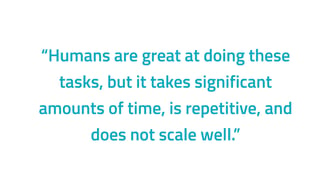
Humans are great at doing these tasks, but it takes significant amounts of time, is repetitive, and does not scale well. The result is an expensive, non-standardized, manual approach that distracts engineers away from the most valuable issues such as optimizing asset performance.
Many teams think that it's impossible to capture this knowledge and use it in an automated method.
By working with numerous critical asset operators, we’ve developed an approach that allows operators to capture and translate engineering knowledge into an automated process.
METHODS
There are four methods we can use to simulate a diagnostic process that engineers are doing. To be clear, these don’t represent exactly how a human does this analysis in their head. Still, these methods allow us to efficiently capture and deploy that knowledge in an automated digital system.
These methods cover both the triggers (such as a specific fault code, a threshold being crossed, general anomaly detection, etc.), as well as the diagnostic process used to analyze the trigger (why did it occur, what is the priority, what does it mean, what do we do about it?). This can also cover diagnostics such as optimization approaches with no trigger (how can I optimize output or performance?).
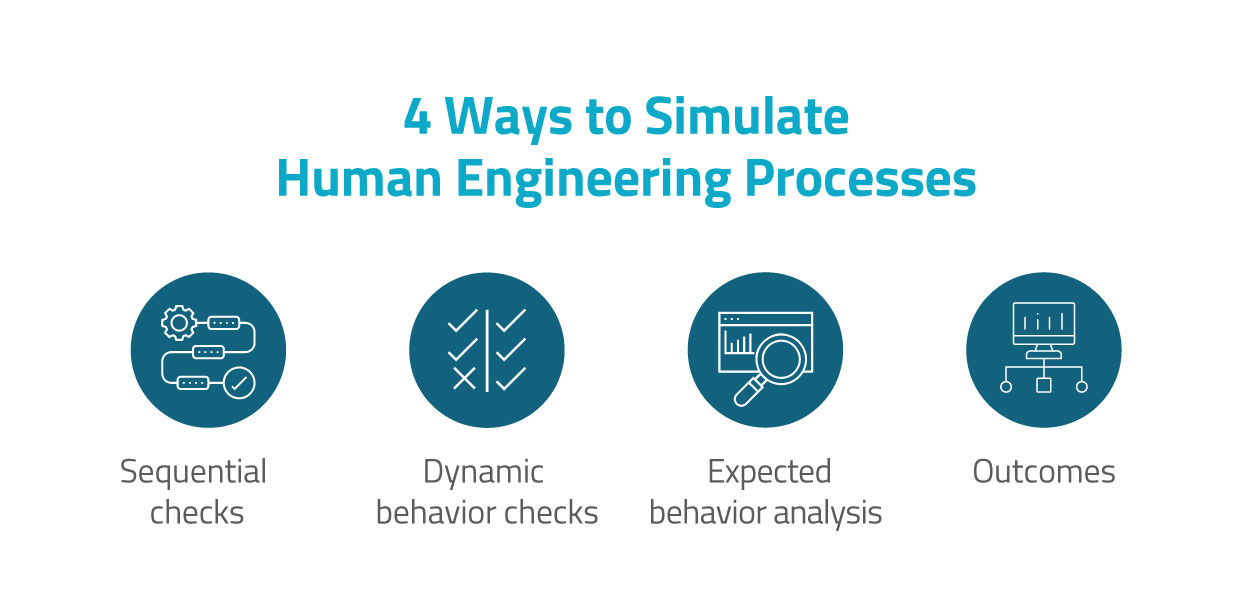
The four methods we utilize to simulate human engineering processes are:
1) Sequential checks
These are common logical tests, consisting of items such as did this and that both happen? These are typically used to bring in context such as what else was happening at the time of the event. Examples are: Did this and that happen at the same time, when a threshold was crossed on X sensor was Y also exceeding limits, and when the asset was underperforming what else was happening?
2) Dynamic behavior checks
These are checks that are typically used to determine how the asset is performing over time, compared to itself. Examples are looking at trends, dynamic rolling means, thresholds, and performance curves based on historical performance.
3) Expected behavior analysis
This type of analysis is used to establish expected behavior, and forms the basis for anomaly detection, as well as for analysis such as performance loss and derate detection. Methods include checking for deviations from similar assets at the same location or other assets under the same operating conditions, looking up OEM specification ratings, using known performance curves, etc.
4) Outcomes
Outcomes are where we classify the results of the above methods, which generally falls into the following categories:
- Labels ("Ok to Reset", "Asset Failure", "Data Quality Issue")
- Corrective Actions ("Reset Asset", "Inspect device", "Check sensor")
- Prioritizations ("High, Med, Low", "Group 1")
Summary
Once we assemble these Methods together into a full analytic process, we have a high-quality, measurable process that can simulate the current engineering approach. A significant benefit is we can measure how the automated system is performing - since we can tie the diagnostic process through to actions taken and measure the results!
TAKING IT FURTHER WITH ANALYTICS:
Once we’ve got the basic process understood and matching how engineers are doing it, we can bring in analytics to create more value. Some examples include:
- Use machine learning which can take into account past performance, seasonality, variations over time, etc.
- These models can be trained across hundreds or thousands of assets, over large time periods, and provide insights that are very hard to do manually.
- Automated classification of events using clustering techniques.
- Regression techniques to find correlations between variables that are hard to spot.
- Using a feedback loop such as root cause labeling and action scoring.
- This allows us to tie in manually scored information and feedback, such as root cause labeling, which corrective actions are working, etc.
- This can help bridge the gap between data that is accessible to the analytics from a data historian and data which is asynchronously available later.
At NarrativeWave, we deploy these Methods in an automated way on visual Insight Trees. Each block on the tree can represent one of the types of methods described above, and the full tree runs automatically. The results are presented to the engineers for them to confirm and issue corrective actions.
.gif?width=740&name=Yellow%20Man%20Green%20Decision%20Tree%20Chart%20(4).gif)
REAL-WORLD RESULTS
We have seen some significant gains across productivity and resulting asset performance in deploying systems like this:
- 75% reduction in time to analyze events
- 25% improvement in accuracy
- 90% Reduction in downtime on assets
- Increased communication throughout the organization