Looking to deploy advanced analytics on your energy assets? We’ve helped develop and deploy analytics used on thousands of assets around the world.
We took our learnings and best practices and created the NarrativeWave Lean Analytics Canvas to share them with you.
This Canvas can help you focus and strategize your projects, create better outcomes, and get faster executive sign-off. Use it alongside this guide to help define the who, what, when, where, and why of analytics - enabling you to focus on driving the most value for your organization.
Four key steps to developing analytics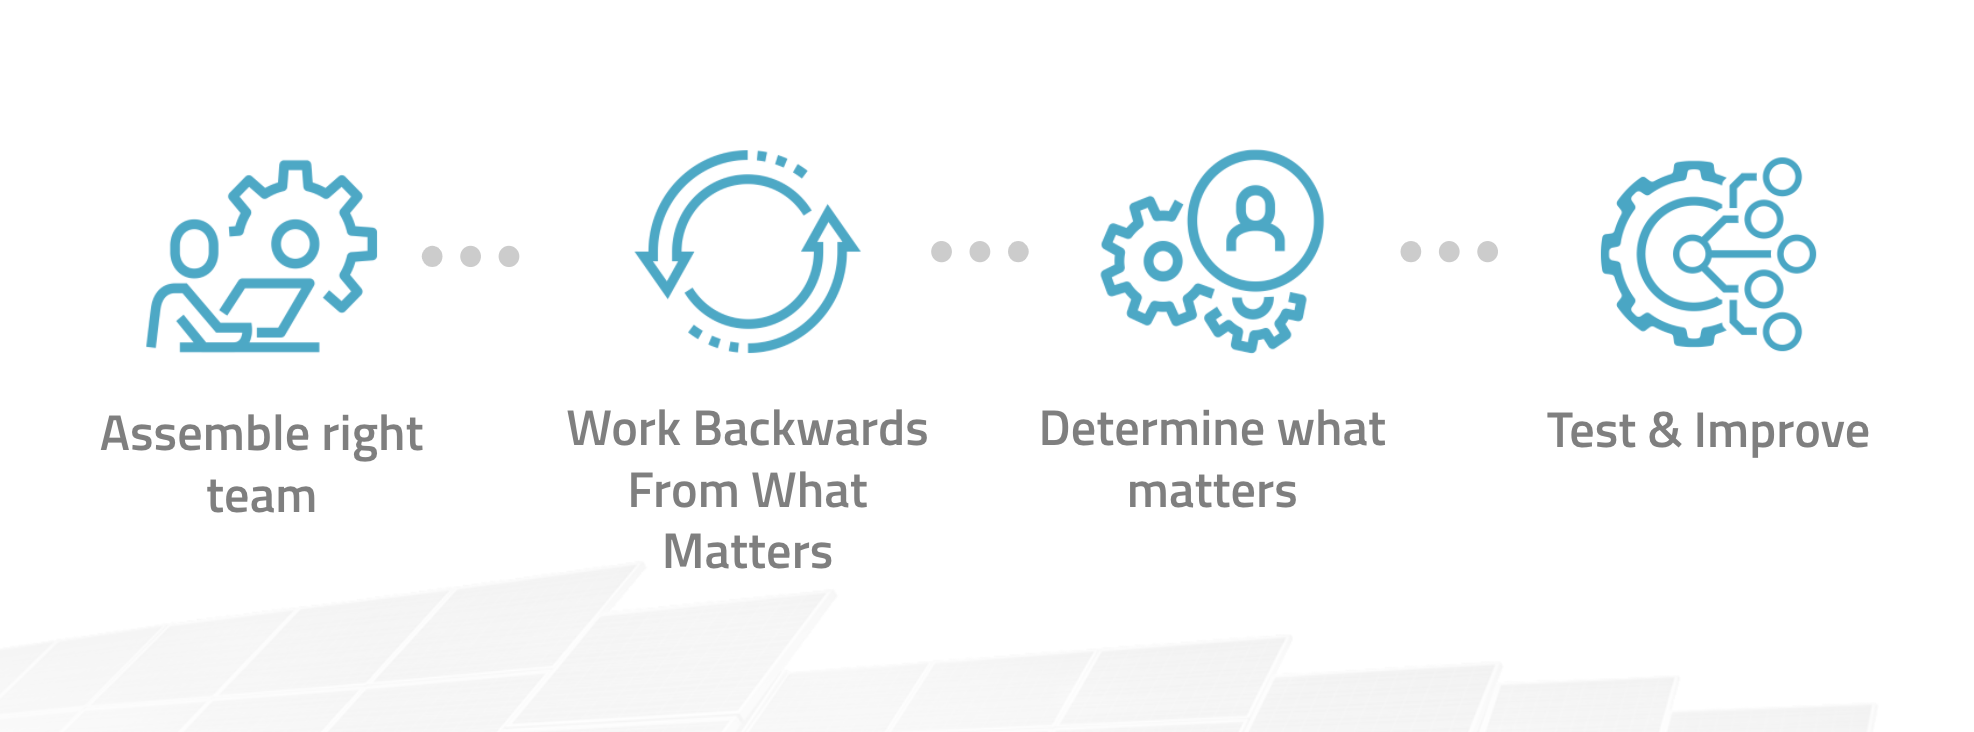
1) Assemble your team with the right skill sets
There are multiple stakeholders, subject matter experts, and decision-makers involved in developing, deploying, and analytics. At heart of the core team is the Process Lead, who is responsible for asking questions, identifying gaps, assembling the problem/value statements, and (if they have the right skills) overseeing the implementation. Other members of the core team include the subject matter experts, engineers, and operational specialists who are closest to the problem you are trying to solve. The supporting team includes data scientists/data engineers, IT personnel who typically control access to the data, and executives with oversight. This deliberate structure, which defines those closest to the problem as the core team, with data science on the team but supporting the core team, keeps the focus on the problem you are trying to solve.
2) Work backwards to determine the most valuable focus
Instead of thinking how to get value from data, a best practice is to ask what problems exist that may be able to be solved with data. By working backwards from the problem, those responsible for building, deploying, and scaling the analytics will ensure that what they build has inherent value.
3) Determine what matters to the organization
In the process of developing a project roadmap, it is important to ask end-users pointed questions about which areas actually matter to the organization. When something valuable triggers, what do you do about it? Who has the knowledge to interpret this data? Who has the ability or authority to take action? Determining which triggers actually cause people to take action is very insightful as to what actually matters to the organization, and will result in higher adoption of the analytics which you build.
4) Tune, iterate, and improve over time
Developing analytics is iterative in nature, so project owners and shareholders should go into an initial deployment with continuous improvement in mind. By planning to tune, iterate, and improve over time, project owners and end-users plan ahead that they will need feedback from deployed analytics - tuning them to reduce false positives, increase anomaly detection, improving accuracy etc. Setting expectations upfront is important so that multiple stakeholders remain involved throughout the lifecycle of using the analytics.
The Lean Analytics Canvas as a Framework

This canvas helps you define the who, what, when, where, and why of developing analytics so you can focus on driving the most value for your organization.
The purpose of this exercise is not to define specific project scope or parameters such as the types of analytics or coding languages, but rather to serve as a guiding roadmap for the project and the people involved. The lean analytics canvas is fundamentally a cover page to a more detailed project plan that keeps laser focus so everyone involved can always draw back to what problems are being solved and what value is being added.
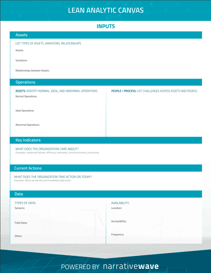
Inputs
First, let’s focus on the inputs, or the areas where you need to ask questions in order to get the right focus. These inputs include:

(Fill out your version: download your blank version of the canvas here.)
- Assets – This is where you will list the types of critical assets and any variations and relationships between them. Knowing asset relationships can be important in creating aggregate statistics, or analytics that run on groups of assets.
- Operations – Here you will identify normal, ideal, and abnormal operations, as well as challenges across assets and people. Simply asking about abnormal operations, or what challenges people are having in managing asset can inform very valuable problem statements. These qualitative statements
- Key Indicators – What does the organization care about? For example, if the organization cares more about efficiency than asset failures, that will lead to a very different focus and is crucial to know upfront.
- Current Actions – One of our favorite questions is asking which triggers or events an organization is actually taking action on today, or, if they saw it happen, would take action on promptly. This can be very insightful as to what an organization (and operators) actually care about, and helps avoid projects with poor adoption.
- Data – Lastly, define the types of data inputs (sensors, field data, etc.) and the availability of data (location, accessibility, frequency, etc.) to match up against the problems you are trying to solve. By viewing data as a resource in support of solving the problem, you can then focus on whether you need to create new features through engineering, or even add new sensors - because you have already defined the value of solving the problem.
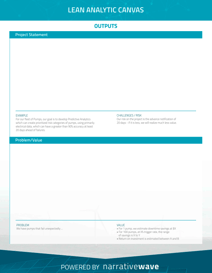
Outputs
Working backwards from assets, operations, key indicators, current actions, and data will come together in the form of a Project Statement and Problem/Value Statement, both of which will help guide the resulting design, build, and deployment of self-service analytics.

(Fill out your version: download your blank version of the canvas here.)
- Project Statement – The project statement should be very focused so managers, executives, and other stakeholders can quickly and easily understand the scope of the project and the associated goals/objectives. We can also identify high level challenges so everyone is aware of them and how they may affect the project.
- Problem/Value – The problem / value statement is now very focused because it represents the scaling up of solving a problem, rather than a vague or unknown issue. Because we have involved those closest to the problem from the very start, we have buy-in from the users, a clearly defined problem, and can create a projected value statement (typically a range).
We’re here to help.
While the returns that come from deploying advanced analytics are immense, implementing from under a pile of data can feel overwhelming. At NarrativeWave, we are passionate about helping operations like yours to streamline their outputs.
That’s why we built NarrativeWave’s self-service toolset - to empower you to combine your existing knowledge with pre-built analytic building blocks, allowing your team to see results fast. You don’t need to hire an army of IT experts to leverage your organization’s analytics; your team members can create, deploy and scale analytics without coding experience.
Access your Lean Analytic Canvas Worksheet now and get started:
.